
Logs & observability tools

Stack trace formatterfor JavaScript, Python, Java, Go, C#, and Rust

Paste a stack trace, let auto-detect pick the language (or choose one yourself), and get a clean frame list with the noisy frames foldable.

Stack trace formatter

Example:
Language

Stack trace

Runs locally in your browser. The stack trace is never uploaded.

Frames

Typing… parses automatically

A raw stack trace dumped into a terminal or a bug report is a wall of nearly identical "at ..." or "File ..." lines, and the one frame that actually points at your code is buried somewhere in the middle of framework internals. Whether you call it a stack trace formatter, a stack trace parser, or a stack trace beautifier, the job is the same: turn that wall of text into something you can pretty print and actually scan.

Use it the moment you are staring at a real exception — from a browser console, a CI log, a crash report, or a teammate's chat message — and need the call chain, the exact file and line, and the root cause without manually counting "Caused by:" blocks or scrolling past fifty node_modules frames. Everything is parsed in your browser tab; nothing you paste is uploaded anywhere.

Why use this stack trace formatter

Built to read six real stack trace formats, not one generic pattern stretched to fit.

Auto-detect that you can still override

Paste a trace and the language is usually picked correctly by scanning the frame syntax itself — no dropdown needed. When a trace mixes styles or detection guesses wrong, six explicit languages (JavaScript/Node, Python, Java/Kotlin, Go, C#/.NET, Rust) are one click away, so you are never stuck with a guess you cannot correct.

A language dropdown switching from Auto-detect to a manually chosen language while the same trace re-parses

Caused-by chains shown as separate blocks

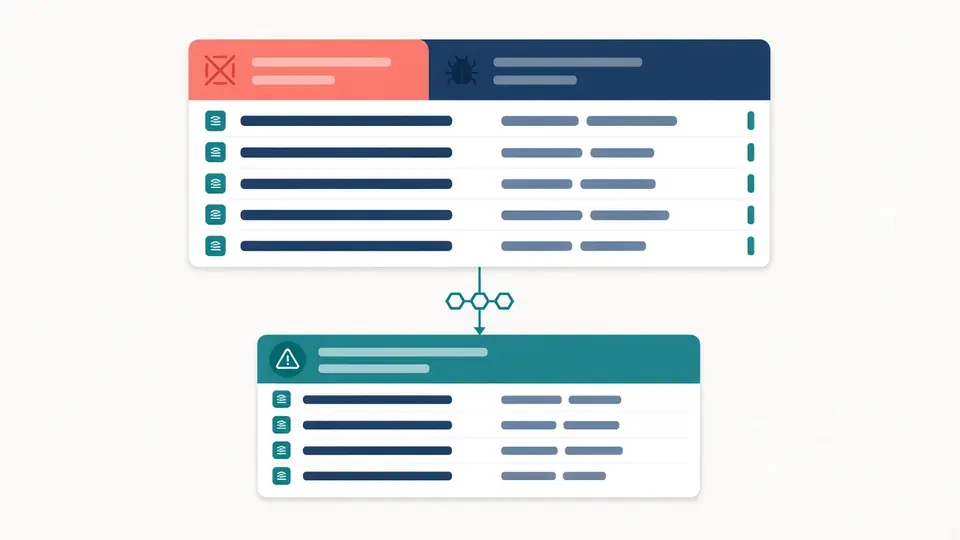
A Java exception with a Caused by: chain or a Python traceback chained by "During handling of..." is split into its own labeled blocks in order, so the root cause at the bottom is as easy to find as the outer exception at the top — instead of one long indistinguishable scroll of frames.

A Java stack trace split into two blocks connected by a Caused by label, root cause shown last

Framework noise folds into one line

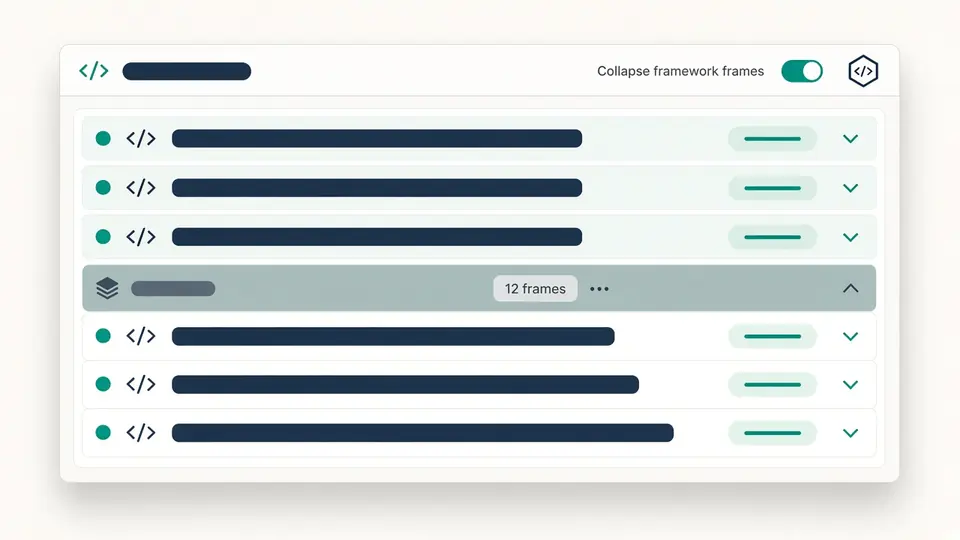
Turn on Collapse framework frames and runs of node_modules, site-packages, org.springframework, runtime., or similar frames fold into a single "N frames collapsed" row, so your own code is what you see first — any folded row expands again with one click.

A run of node_modules frames folded into a single collapsed summary row above the user's own frame

Three things this frame list does for you automatically

Parse a trace, fold what you don't need, and copy exactly what you do.

01

Paste any of six supported formats

Drop in a raw JavaScript/Node, Python, Java/Kotlin, Go, C#, or Rust stack trace — no cleanup needed first. Parsing fires automatically about a third of a second after you stop typing, or flip off auto-parse for a manual button plus Ctrl/Cmd+Enter.

  • Load one of the three built-in examples to see a Caused-by chain, a Python traceback, and node_modules noise without typing anything
  • A line that doesn't match any known frame format is kept as-is and marked Unrecognized instead of breaking the whole parse
02

Fold the frames you don't need to read

Consecutive node_modules, site-packages, java./org.springframework., runtime., std::/core::, or System. frames — whichever match the detected language — fold into a single "{count} frames collapsed" row when the toggle is on. Toggling it doesn't re-parse anything, it just regroups the same result instantly.

  • A single framework frame surrounded by your own code is left alone — folding only kicks in for runs of two or more in a row
  • Every folded group is individually clickable to expand just that run without turning the whole toggle off
03

Copy exactly what you need

Click any recognized frame's file:line to copy just that location — useful for jumping straight to a line in your editor. Copy and Download export the whole reformatted trace as plain text in that language's own idiomatic style, and both stay disabled the instant you edit the input or change an option, so you can never walk away with a stale copy.

  • The exception type and message are pulled out and highlighted above the frame list for every block, including each Caused-by cause
Jump to the formatter

What the frame list gives you beyond raw text

Structured fields, chain detection, and noise folding built for six real formats.

Six-language frame recognition

JavaScript/Node, Python, Java/Kotlin, Go, C#/.NET, and Rust each get their own frame syntax, split into function name, file, line, and column wherever the format provides them, so this stack trace formatter reads like the runtime's own output, not a generic dump.

Caused-by and traceback chains

Java's Caused by: chain and Python's chained tracebacks are detected as separate blocks, in order, root cause included — no counting indentation levels by eye.

Foldable framework noise

node_modules, site-packages, java./org.springframework., and other framework namespaces collapse into a single summary row per language, and any folded group expands again with one click.

Per-frame file:line copy

Every recognized frame has its own copy control for just its file and line, separate from copying the whole trace.

Unrecognized lines stay visible

A line that doesn't match the selected format's syntax is kept in place and labeled Unrecognized instead of being dropped or failing the whole parse.

What this formatter does and doesn't do

The real behavior and limits, not a generic disclaimer.

No symbolication or source-map reversal
Minified function names and compressed file paths are shown exactly as pasted. Turning them back into original source locations needs the matching source map or debug symbols, which this stack trace formatter never uploads or fetches.
Text stack traces only, not binary dumps
Core dumps, minidumps, and other binary crash artifacts aren't accepted — paste the text stack trace your runtime or crash reporter already printed.
Six declared languages, not an open-ended guess
Only JavaScript/Node, Python, Java/Kotlin, Go, C#/.NET, and Rust frame syntax is recognized. Ruby, PHP, C/C++, and Swift traces will come back mostly Unrecognized rather than being force-fit into the wrong format.
Copy and download always produce plain text
The reformatted output never wraps itself in a Markdown code fence, even though some competing tools do — it stays plain text so it pastes cleanly into a terminal, an IDE, or a ticket.

Stack trace formatter FAQ

Answers to the questions people ask before pasting a real exception into an online tool.

Is it safe to paste a stack trace into an online tool?

Yes — this tool parses everything as JavaScript running in your current browser tab. Nothing you paste is uploaded, logged, or sent to a server, including any local file paths or usernames that show up in the frames.

How do I hide node_modules frames in a stack trace?

Turn on Collapse framework frames in the toolbar. Consecutive node_modules (or site-packages, java./org.springframework., and similar) frames fold into a single row, and clicking that row expands just that group again.

Does this stack trace formatter support Java, Python, and JavaScript?

Yes, along with Go, C#/.NET, and Rust — six languages in total. Auto-detect usually picks the right one from the frame syntax; you can also force a specific language from the dropdown.

What's the difference between a stack trace, a traceback, and a backtrace?

They're the same concept under different names by ecosystem — Python calls it a traceback, C and Ruby often say backtrace, and JavaScript, Java, C#, Go, and Rust generally say stack trace. This tool recognizes all of them; pick whichever term you're used to.

Will this remove file paths or usernames from my stack trace before I share it?

No — paths and other details are shown exactly as pasted, nothing is redacted automatically. Since nothing leaves your browser in the first place, review the text yourself before pasting it somewhere less private, like a public bug tracker.

Does it work for Go panics and Rust backtraces, not just exceptions?

Yes. Go goroutine dumps (a function name line plus a tab-indented file:line pair) and Rust's RUST_BACKTRACE=1 numbered-frame output both parse the same way as the exception-style languages, including their own framework-frame patterns like runtime. and std::/core::.

Found a real trace this formatter gets wrong?

Format your stack trace now

Paste any JavaScript, Python, Java, Go, C#, or Rust stack trace and get a readable frame list in under a second — no upload, no account.

Bookmark this free stack trace formatter for the next exception that lands in your terminal or your inbox.

All parsing happens locally in your browser.