Logs & observability tools

Log viewerfor JSON, logfmt, Kubernetes and Docker logs

Paste or open a log file, click Format, then filter by level, search, and switch how timestamps are shown — all on the already-parsed rows.

Log viewer

Example:
Format presetTimestamp
Level

Log text

Runs locally in your browser. Nothing you paste or open is uploaded.

Parsed lines

Format a log to see rows here.

Paste a log or load the example, then click Format.

A single grep gets you a handful of matching lines, but it stops being enough the moment a support ticket contains a mix of structured JSON events, a stray logfmt line from a middleware, and a Kubernetes container's stdout all pasted together. Working out which lines are errors, what a garbled Unix timestamp actually means, and which requests match a given user ID by eye is slow and error-prone.

This log viewer is for the moment you have that mixed paste in your clipboard and need a readable table instead of a wall of text: it detects the shape of each line on its own, extracts a level and a message where it can, and lets you narrow down to what matters without re-running anything. It is not a replacement for a real log aggregator watching a live pipeline — it works on a static block of text you paste or open from a local file, once, in the browser tab you are already in. Some people call this kind of tool a log viewer, others a log formatter; either name points at the same job: turning pasted text into a readable table.

Why use this log viewer

Built around one mixed paste, not one format at a time.

One paste, five shapes recognized line by line

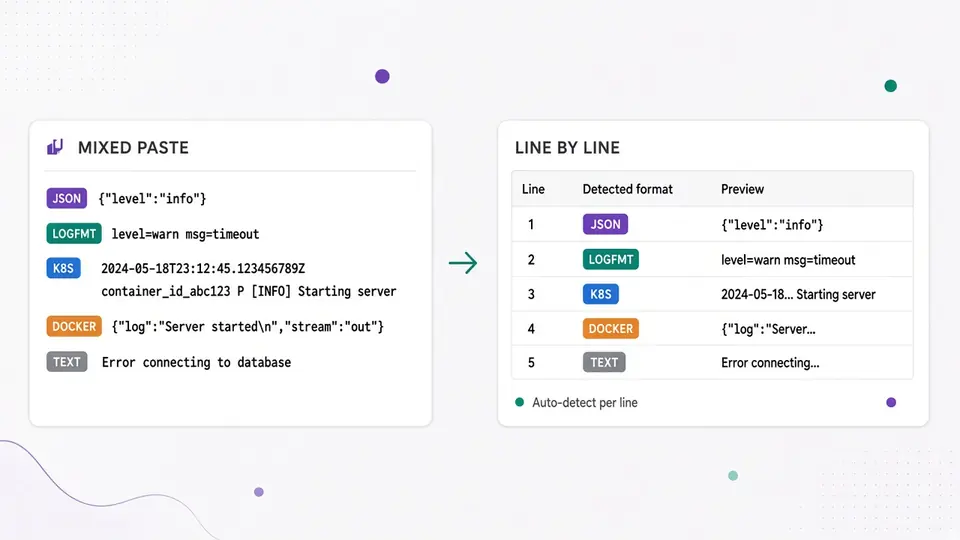
JSON events, logfmt key=value pairs, a Kubernetes container's CRI-formatted stdout, a Docker json-file driver line, and plain text can all sit in the same paste — Auto-detect classifies each line on its own instead of forcing one format for the whole block, and a line that matches nothing still shows up as plain text instead of being dropped.

A pasted block mixing JSON, logfmt, Kubernetes and Docker log lines, each row labeled with its detected format

Filters, search and timestamp display update instantly

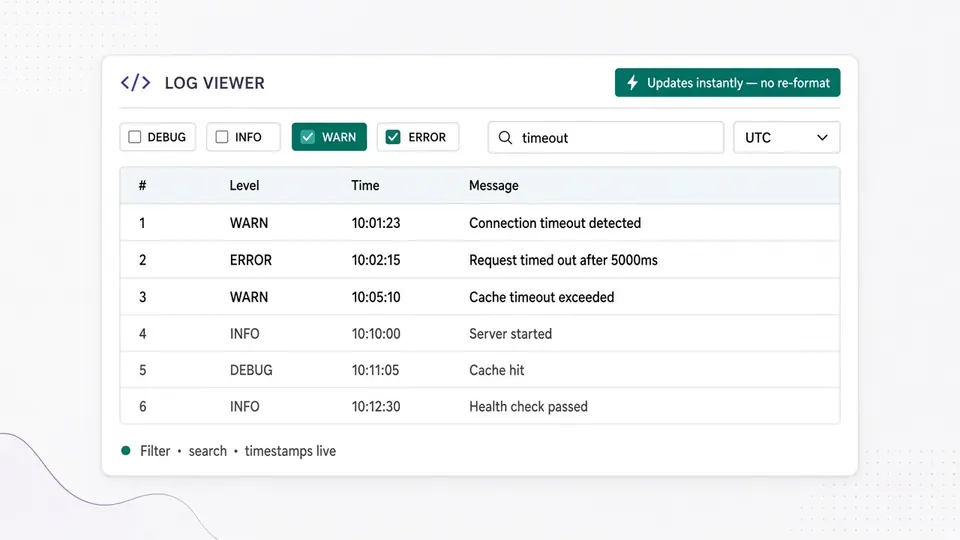
Formatting a fresh paste is a deliberate click (or Ctrl/Cmd+Enter), but once the table exists, checking or unchecking a log level, typing a search term, and switching between raw, local, UTC and relative timestamps all recompute immediately on the already-formatted rows — no need to click Format again for any of that.

A results table where toggling a level checkbox and typing a search term update the visible rows without a reformat button being pressed

From a mixed paste to a table you can trust

Three steps, and what each one actually does under the hood.

01

Paste, open a file, or load the mixed sample

Paste log text directly, or click Open file to read a local .log/.txt/.json file with the browser's file reader — the file is never uploaded anywhere. Format preset defaults to Auto-detect, so most of the time you do not need to pick a shape yourself, but if you already know every line is, say, logfmt, forcing that preset skips the detection step entirely.

  • Ctrl/Cmd+Enter runs Format without leaving the keyboard
02

Click Format and read the result table

Formatting does not run automatically while you type — re-detecting the shape of every line on each keystroke would be wasted work for a paste that is still being edited. Click Format once (or use the shortcut) and every non-blank line becomes a row: click a row's Fields button to see exactly what was extracted, including the raw fields from a JSON object or logfmt pair.

  • A line that does not match any known shape still gets a row with format "text" — it is never silently dropped or treated as an error
03

Filter, search and export without reformatting

Level checkboxes start fully checked, so nothing is hidden until you uncheck one — and a line the tool could not confidently classify with a level always stays visible regardless of which boxes are checked, since hiding unclassifiable content would be a guess, not a filter. Search can switch to regex, and the timestamp column can switch between raw, local time, UTC, and relative — none of which touch the text you pasted. Copy or download exactly the currently filtered rows as plain text or structured JSON with a parsed epoch value.

  • Switching the level filter, search, or timestamp display never grays out the table — only editing the input or the format preset does, because those actually require a fresh Format
Jump to the log viewer

What the table gives you beyond raw text

Detection, filtering and export built for a paste you did not write the parser for.

Five formats detected per line, not per paste

JSON, logfmt, Kubernetes CRI, Docker json-file, and plain text are each detected independently for every line, so one mixed paste from several sources still produces one consistent table instead of forcing you to split it first.

Level filter and keyword or regex search

Narrow the table to specific severities and a search term at the same time, with an optional regex toggle, all recomputed on the already-formatted rows without re-running detection.

Four timestamp displays, always non-destructive

Switch the timestamp column between the raw text you pasted, your local time, UTC, or a relative phrase like "3 minutes ago" — it only changes what that column shows, never the original text sitting in the input box.

Per-line field panel and two export formats

Expand any row to see every field the detector pulled out — a JSON object's keys, a logfmt pair, or a Kubernetes stream and tag — and export the currently filtered rows as plain text or as structured JSON that includes a parsed epoch timestamp.

What this tool does not do, on purpose

Real limits, not a marketing list.

Kubernetes and Docker are format presets, never a live connection
Selecting the Kubernetes or Docker format preset only tells the detector which line shape to expect (CRI-formatted stdout, or a json-file driver line); it never connects to a real Kubernetes API server or Docker daemon to pull live logs, and the tool makes zero network requests of any kind.
A line with no detected level is never hidden by the level filter
If the detector cannot confidently pull a level out of a line, that line stays visible no matter which level checkboxes are checked or unchecked — filtering out content it could not classify would be an arbitrary guess, not a real filter.
The timestamp display never rewrites your input
Switching between raw, local, UTC, or relative only changes how the Timestamp column renders a detected value; the text in the input box is untouched. For converting or batch-processing timestamps on their own, use the separate Unix timestamp converter.
One paste is capped at 300,000 characters and 20,000 lines; one file at 2 MB
This keeps formatting fast and predictable in a browser tab. Going over either limit rejects the whole run with a clear error instead of silently truncating your log, so you always know exactly what got formatted.

Log viewer FAQ

Answers to the questions people ask before pasting logs into an online tool.

Is there a free JSON log viewer that works online without an account?

Yes. Paste or open your log, click Format, and the table appears immediately in this log viewer — no account, install, or upload required. It runs as JavaScript in your current browser tab.

Is it safe to paste log files into an online tool like this?

Nothing you paste or open is sent anywhere. Formatting, filtering, searching, and exporting all happen locally in your browser tab; there is no server-side upload, storage, or logging of the text, which matters because real logs often contain user IDs, IPs, and other sensitive details.

What is the difference between logfmt and JSON log lines?

logfmt is a flat key=value format on one line (level=info msg="done" duration=12ms), designed to be both human-readable and easy to grep. JSON log lines are one JSON object per line, more structured and easier to parse programmatically but harder to scan by eye. This log viewer detects and extracts fields from both automatically, so you do not have to pick a parser ahead of time.

How do I convert a log timestamp to a readable date online?

Once you format a log, switch the Timestamp dropdown to Local time, UTC, or Relative and every row's detected timestamp re-renders in that format — the raw text in the input is never changed. For converting one timestamp on its own outside a log, use the site's dedicated Unix timestamp converter instead.

Does this tool connect to my Kubernetes cluster or Docker daemon?

No. "Kubernetes container log" and "Docker json-file log" are format presets that tell this log viewer which line shape to expect when you paste text you already copied out — they are not a live connection, require no credentials, and the tool makes no network requests at all. For live tailing of a running cluster or container, you need a different, connected tool.

How do I filter logs by keyword online?

Type a term into the search box and the table narrows instantly to lines containing it, without re-running Format. Turn on the regex toggle next to it to search with a regular expression instead of a plain substring, and combine it with the level checkboxes to narrow by both at once.

Found a real log line this tool gets wrong?

Use this log viewer now

Paste a mixed block of JSON, logfmt, Kubernetes, Docker, or plain-text log lines and get a filterable, exportable table in seconds — no upload, no account.

Bookmark this free log viewer for the next time a support ticket or a terminal dump lands in your clipboard as a wall of unreadable text.

All formatting happens locally in your browser.