Logs & observability tools

AWS log parserfor CloudFront and ALB access logs

Paste a CloudFront standard access log or an ALB access log, let the format auto-detect (or pick it yourself), and click Parse log to get a filterable table.

AWS log parser

Example:
Log type
Filters

Access log

Runs locally in your browser. The log text is never uploaded, and no AWS account is needed.

Parsed rows

Parse a log to see rows here.

Paste a CloudFront or ALB log, or load an example, then click Parse log.

CloudFront and ALB write two of the most common access logs on AWS, and neither one is friendly to read by eye: CloudFront's fields depend on which columns you enabled when you turned logging on, and ALB packs 30-plus space-separated values, several of them quoted, into a single line. Call it an AWS log parser or an AWS access log analyzer — either way, it exists for the moment you have a chunk of one of those logs — pasted from a support ticket, downloaded from S3, or copied out of a CloudWatch export — and need to know which edge location served a request, which target returned a 502, or which client IP is hammering a path, without setting up Athena or writing a query.

Use it when the job is a quick read of a few hundred or a few thousand lines, not a standing analytics pipeline. Everything runs in your browser tab; the log text is never uploaded, and no AWS account or S3 access is required.

Why use this AWS log parser

Built around how these two AWS formats actually declare their own fields.

CloudFront's own header tells the parser what the columns are

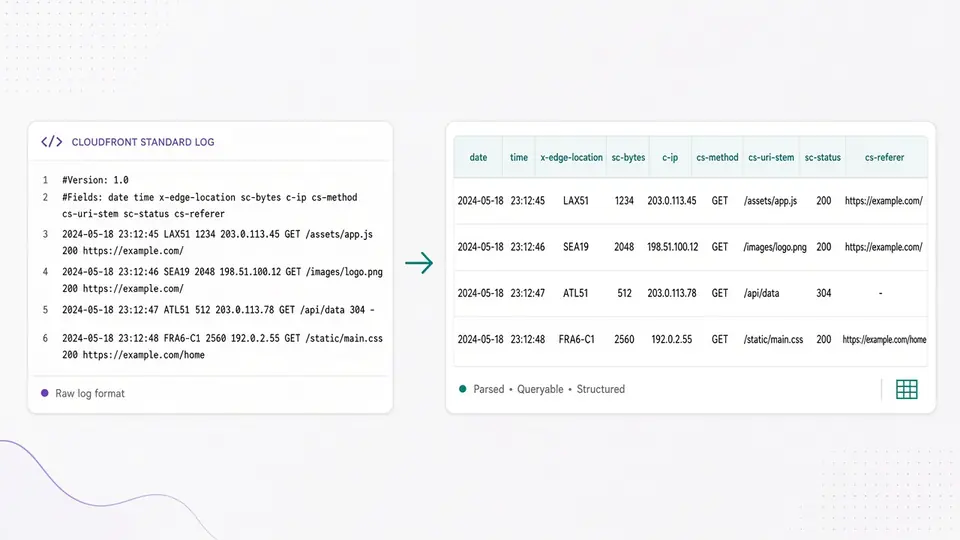
A CloudFront standard log starts with #Version and #Fields lines that name every column in order. This parser reads those two lines instead of assuming a fixed layout, so when AWS ships a log with more fields than last year's, the table just grows with it — no update to this tool required, and no version number to pick from a list.

A CloudFront #Fields header line being mapped straight into table columns

Format-specific stats, not a generic access-log summary

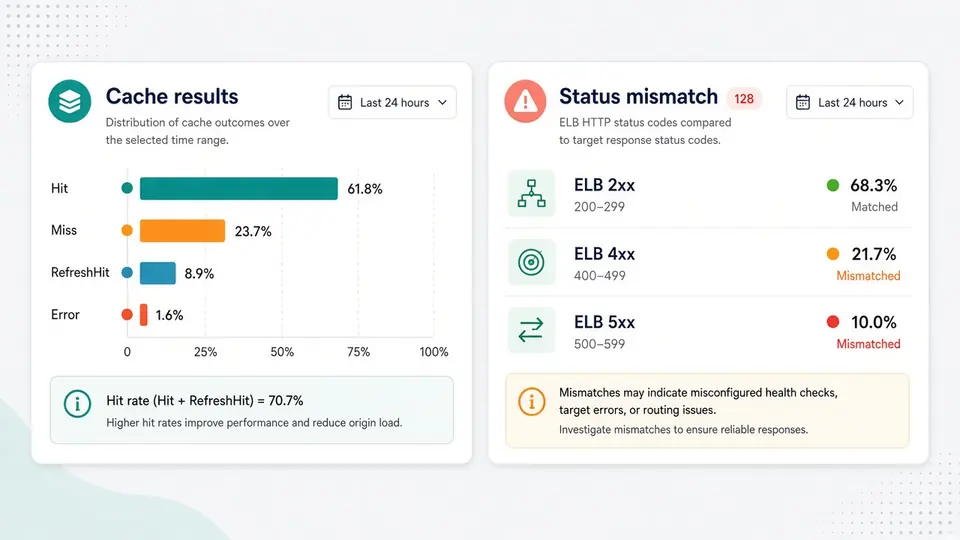
CloudFront gets a cache-result breakdown (Hit, Miss, RefreshHit, Error) and a top-edge-locations list — the two things you actually check when a CDN behaves oddly. ALB gets an actions-executed breakdown and a count of requests where the load-balancer status code disagrees with the target's, which is usually the first sign of a misbehaving backend.

Separate cache-result and ELB/target status-mismatch statistics panels

From a raw AWS log to a filterable table

Parse a log, filter it, and export a clean table in three steps.

01

Paste the log and let it auto-detect

Paste a CloudFront standard log or an ALB access log. Auto-detect looks only at the first non-empty line: a #Version: line means CloudFront, and a first word of http/https/h2/grpcs/ws/wss means ALB. If neither matches — for example you pasted only data rows with no header — pick the log type manually from the dropdown instead of guessing.

  • Picking CloudFront manually on a log with no #Version/#Fields header does not fail — it falls back to the built-in default field list, which covers the current AWS field set
  • The two built-in examples each load with their format preselected, and each includes one intentionally malformed line so you can see how a mismatch is reported
02

Click Parse log (or press Ctrl/Cmd+Enter)

Parsing does not run automatically while you type — these logs are often thousands of lines, some with more than 30 fields each, and re-matching on every keystroke would be wasteful. Click Parse log once, or use the keyboard shortcut, and the table fills in.

  • Changing the log type afterward does not re-parse by itself; the old table stays visible but dims until you click Parse log again
03

Filter and export

Status code, path, client IP, and (for CloudFront) edge-location filters all apply instantly to the already-parsed rows — no need to click Parse log again. The summary panel below the table updates with the filter, including the cache-result or actions-executed breakdown and the total bytes / average / max latency for whatever is currently shown. Copy or download the visible rows as CSV, JSON, or plain text.

  • The edge-location filter only appears when the log type is CloudFront or Auto-detect — ALB logs have no equivalent field, so the input is not shown at all rather than shown and disabled
Jump to the parser

What this table gives you beyond raw text

Field mapping, four filters, and format-specific stats built for troubleshooting a real AWS access log.

Self-describing field mapping for CloudFront

Column names come straight from the log's own #Fields line, so the table always matches the exact version of the log you pasted, including any custom subset of fields you enabled when you turned on logging.

A fixed, append-only field map for ALB

ALB has no header line, but AWS's own documentation is explicit that new fields are only ever added at the end. This parser maps a line's tokens positionally against the full known field list and reports how many of the known fields actually matched, so an older log with fewer trailing fields still parses cleanly instead of erroring.

Four filters: status, path, client IP, edge location

Narrow the table to a status range or an exact code, a path substring or regex, a client IP substring, and — for CloudFront — an edge-location substring, all without re-parsing the log.

Cache-result and action breakdowns, plus status mismatches

CloudFront rows are summarized by x-edge-result-type (Hit, Miss, RefreshHit, Error and friends); ALB rows are summarized by the comma-separated actions_executed value, plus a count of requests where the ELB and target status codes disagree.

Bad lines with line numbers

A line whose column count does not match the detected format is listed with its 1-based line number and original text, so a handful of odd lines never silently disappear from the count.

CSV, JSON, or plain text export

Export exactly the rows currently shown by the filters, with the same columns as the table, ready to drop into a spreadsheet or another tool.

What this parser reads, and what it does not

The exact behavior around field detection, malformed lines, and scope boundaries that are unlikely to change.

CloudFront needs matching column counts, ALB needs at least 13 tokens
A CloudFront data line is only accepted if its tab-separated column count exactly matches the active field list (from #Fields, or the built-in default). An ALB line needs at least 13 space-separated tokens — enough to reach the quoted request field — or it is listed as a bad line rather than guessed at.
ALB fields beyond the known 34 are simply not mapped
If a future AWS release appends fields past the ones this parser currently knows, those trailing values are not shown as extra columns — the field-coverage note will still read the true known-field count against the total, so you can tell when the log is newer than this tool's field list.
This parses the classic text log format, not CloudFront Standard Logging v2's JSON or Parquet output
CloudFront Standard Logging v2 can also deliver JSON or Parquet files. Parquet is a binary columnar format that a browser cannot usefully parse as pasted text, so this tool only handles the classic W3C-style text format (the legacy format, and the equivalent w3c output option in v2).
No S3, no AWS credentials, no real-time or streaming logs
This tool never asks for a bucket name or access key and never makes a network request — you paste text you already have. It also does not read CloudFront real-time logs, which are delivered through Kinesis Data Streams rather than as a file you can paste.
One paste is capped at 300,000 characters and 20,000 lines
This keeps parsing fast and predictable in the browser tab. Split a larger log export into batches if you hit the limit.

AWS log parser FAQ

Answers to the questions people ask before parsing a CloudFront or ALB access log online.

What are the fields in a CloudFront access log?

It depends on your distribution's logging configuration and when you turned it on — that is exactly why this parser reads the field names from your log's own #Fields line rather than assuming a fixed list. Paste your log and the table's column headers are the real field names for your version, from date and c-ip through less common ones like fle-status or sc-range-start.

How do I parse the fields in an AWS ALB access log?

Select ALB (or let Auto-detect find it from the first word, such as https or http), paste the log, and click Parse log. ALB has no header line, so this parser maps each line's space-separated tokens against AWS's documented field order — type, time, elb, client:port, and so on through the newer fields like classification and ip_address.

What does the CloudFront log format version field mean?

It is the value on the #Version: line at the top of a CloudFront standard log, currently 1.0 for the classic text format. This parser reads and displays it as-is; it is informational, not something you choose, and a log pasted without that line still parses using the built-in default field list.

How can I correlate CloudFront and ALB logs for the same request?

This parser does not automatically join the two logs — it parses each one on its own. What it does give you is the fields you need to match rows by hand: CloudFront's x-edge-request-id and x-forwarded-for, and ALB's trace_id, which AWS documents as the value to carry across both hops.

Is it safe to paste AWS access logs into an online tool like this?

Nothing you paste is sent anywhere. Parsing, filtering, and exporting all happen locally in your browser tab with JavaScript; there is no server-side upload, storage, or logging of the text you paste, and no AWS account or S3 access is requested at any point.

What are the new fields in ALB access logs, like conn_trace_id or classification?

AWS has added fields to the end of the ALB log format several times since 2016 — classification and classification_reason for desync mitigation, conn_trace_id, and more recently transformed_host and ip_address. This parser maps as many of the known 34 fields as a given line actually has and reports the count, so it stays useful on both older and newer ALB logs without you having to know which release added what.

Does this support CloudFront Standard Logging v2's JSON or Parquet format?

No — this parser only reads the classic, tab-separated text log format (the legacy format and the equivalent w3c option under Standard Logging v2). Parquet is a binary columnar file, not something you can usefully paste as text, so that output option is out of scope for a browser-based text parser.

Found a real-world log line this parser gets wrong?

Parse your CloudFront or ALB log now

Paste a CloudFront standard log or an ALB access log and get a filterable, exportable table in seconds — no S3, no AWS credentials, no upload.

Bookmark this AWS log parser for the next time you need to check a cache-hit ratio, find who is hitting a path, or see why a target group is returning the wrong status code.

All parsing happens locally in your browser.