Logs & observability tools

Access log parserfor real Nginx and Apache formats

Paste an Nginx or Apache access log, pick a format template (or paste your own log_format/LogFormat line), and click Parse log to get a filterable table.

Access log parser

Example:
Format template
Filters

Access log

Runs locally in your browser. The log text is never uploaded.

Parsed rows

Parse a log to see rows here.

Paste an access log or load the example, then click Parse log.

A one-off grep gets you a handful of matching lines, but it stops being enough the moment you need to know which client IPs are hammering /api/login, how many requests came back as 5xx in the last batch of logs, or which lines do not even match your server's format. Whether you think of this as an access log parser or a log analyzer, understanding the shape of the line is faster than rebuilding that regex from scratch every time.

Use it when you have pasted a chunk of Nginx or Apache access log from a server, a support ticket, or a load balancer dump and need real fields — IP, status code, path, bytes, referer — instead of a wall of text. Everything runs in your browser tab; nothing you paste is uploaded anywhere.

Why use this access log parser

Built around real server formats, not a handful of hardcoded placeholders.

Paste your real log_format or LogFormat line

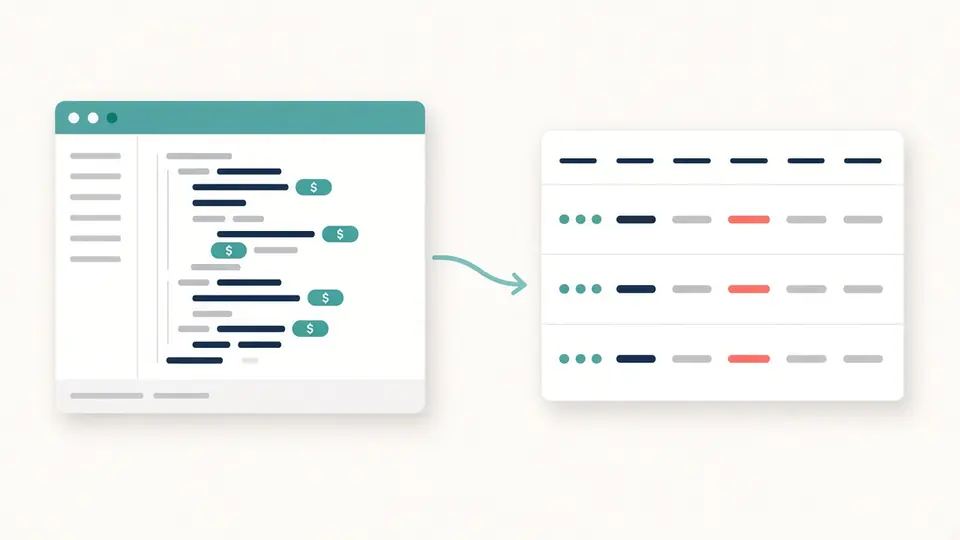
Copy the exact log_format directive from nginx.conf or the LogFormat line from httpd.conf, including custom fields like $upstream_response_time or %{X-Forwarded-For}i, and this access log parser turns it straight into table columns — no new placeholder syntax, no guessing which of a handful of presets is closest.

A raw nginx log_format directive being turned into matching table columns

Bad lines are listed, not hidden

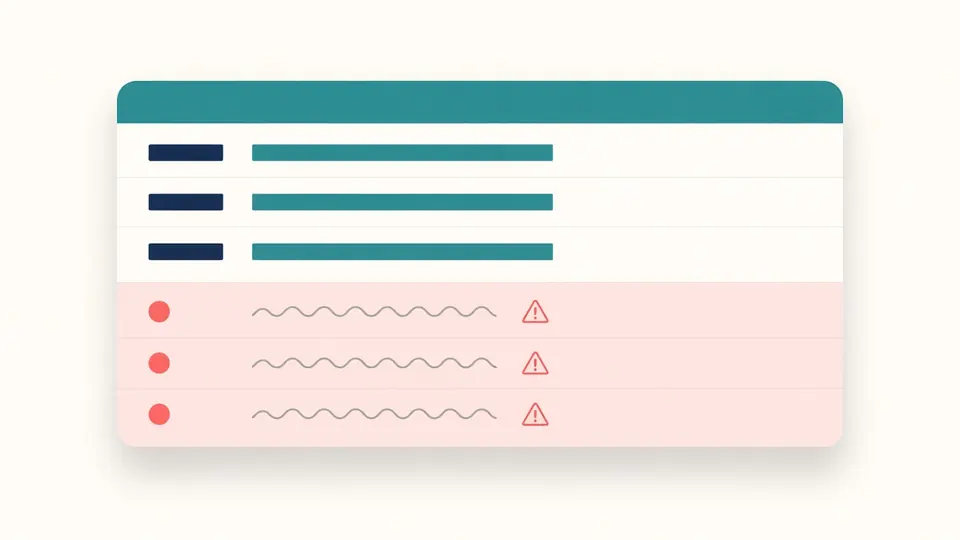
A line that does not match the chosen format is not silently dropped or waved off with a generic warning. It shows up with its line number and original text, so you can see exactly why it did not match instead of wondering if rows are missing.

A list of unmatched log lines shown with their line numbers and raw text

From raw log lines to a filterable table

Parse a log, filter it, and export a clean table in three steps.

01

Paste the log and pick a format

Paste raw lines from an Nginx or Apache access log. If you are not sure which preset matches, load the built-in example first — it includes one intentionally malformed line so you can see how mismatches are reported.

  • Nginx combined and Apache combined are the same shape (IP, time, request, status, bytes, referer, user agent) — pick either one, they parse identically
  • Choosing Custom accepts the literal log_format/LogFormat text, not a regex you have to write yourself
02

Click Parse log (or press Ctrl/Cmd+Enter)

Parsing does not run automatically while you type — access logs are often thousands of lines, and re-matching the whole thing on every keystroke would be wasteful. Click Parse log once, or use the keyboard shortcut, and the table fills in.

  • Changing the format template afterward does not re-parse by itself; the old table stays visible but dims until you click Parse log again
03

Filter and export

Status code and path filters apply instantly to the already-parsed rows — no need to click Parse log again for those. The summary panel (top IPs, top paths, status breakdown) updates with the filter. Copy or download the visible rows as CSV, JSON, or plain text.

  • The status/path filters only affect what is shown and exported, never the underlying parsed line count reported in the status line
Jump to the parser

What this table gives you beyond raw text

Field extraction, filters, and aggregate counts built for troubleshooting a real access log.

Four built-in format presets

Nginx combined, Nginx common, Apache Common Log Format, and Apache combined cover the vast majority of default server configurations without any setup.

Real log_format and LogFormat directives as custom templates

Any $variable from nginx.conf or %letter directive from httpd.conf — including named request/response headers like %{Referer}i — becomes a table column, matched against the literal text around it in your directive.

Status code and path filters

Narrow the table to a status range (2xx–5xx) or an exact code, and to requests whose path contains a substring or matches a regex, without re-parsing the log.

Top IPs, top paths, and a status breakdown

A summary panel counts requests by status code and lists the busiest client IPs and request paths in the currently filtered rows — the first things you check when hunting down a spike or an attacker.

Bad lines with line numbers

Every line that does not match the chosen format is listed with its 1-based line number and original text, so a handful of odd lines never silently disappear from the count.

CSV, JSON, or plain text export

Export exactly the rows currently shown by the filters, with the same columns as the table, ready to drop into a spreadsheet or another tool.

What counts as a match, and what does not

The exact behavior around malformed lines, custom formats, and what stays out of scope for now.

A line either matches the whole format or is marked bad
There is no partial match: if a line does not fit the chosen template end to end, it is listed under bad lines with its line number and text, and none of its fields are added to the table.
A malformed request field still parses, just with empty method/path
If the request part of a line is "-" or otherwise not "METHOD path PROTOCOL", the line still counts as matched and appears in the table — method, path, and protocol are simply left blank for that row, since the rest of the line (IP, status, bytes) parsed correctly.
Custom templates only recognize documented $variables and %directives
An unrecognized Apache %-letter or a template with no $ or % token at all is rejected with a specific error, rather than being guessed at and silently producing the wrong columns.
One paste is capped at 300,000 characters and 20,000 lines
This keeps parsing fast and predictable in the browser tab. Split a larger log export into batches if you hit the limit.
Status/path filters never change the parsed line or bad-line counts
Filtering only changes which already-parsed rows are shown, exported, and summarized. The "parsed N lines, M did not match" status always reflects the last full parse, not the current filter.

Access log parser FAQ

Answers to the questions people ask before parsing an Nginx or Apache access log online.

Is there a free access log parser that works online without installing anything?

Yes. Paste your Nginx or Apache access log above, click Parse log, and the table appears immediately — no account, install, or upload required. It runs as JavaScript in your current browser tab.

Is it safe to paste server logs into an online tool like this?

Nothing you paste is sent anywhere. Parsing, filtering, and exporting all happen locally in your browser tab with JavaScript; there is no server-side upload, storage, or logging of the text you paste, which matters because access logs often contain real client IPs and paths.

What is the difference between the Common Log Format and the combined format?

The Common Log Format (Apache's %h %l %u %t \"%r\" %>s %b) has no referer or user-agent field. The combined format adds both in quotes at the end. Nginx's default named format, also called "combined," matches the same shape as Apache's combined format.

How do I parse an Nginx access log that uses a custom log_format?

Choose "Custom" as the format template and paste the exact log_format line from nginx.conf, such as $remote_addr - $remote_user [$time_local] \"$request\" $status $body_bytes_sent \"$http_referer\" \"$http_user_agent\". Every $variable becomes its own table column, in the order it appears.

Why did some lines end up in the bad-lines list instead of the table?

A line is marked bad when it does not match the selected format template end to end — for example, an error-log line mixed into an access-log paste, a truncated line, or the wrong preset chosen for your server. The bad-lines list shows the line number and original text so you can check the format or fix the source.

Can I filter by IP address or user agent instead of status code and path?

The built-in filters cover status code and path, which are the two fields most people narrow down by. IP address and user agent still appear as regular table columns and in the top-IPs summary, and you can sort or search them after exporting to CSV or JSON.

Is there a size limit for the access log I can paste?

One paste is capped at 300,000 characters and 20,000 lines, which is enough for a large support-ticket excerpt or a several-thousand-line log tail. For a full server log file, split it into smaller chunks and parse each one separately.

Found a real-world log line this parser gets wrong?

Parse your access log now

Paste an Nginx or Apache access log and get a filterable, exportable table in seconds — no upload, no account.

Bookmark this free access log parser for the next time you need to find who is hitting a route or why requests are failing.

All parsing happens locally in your browser.