Files, Binary & Compression

Source map viewerand decoder for minified stack traces

Paste a .map file (or a JS file with an inline map), then type a line:column or paste a whole stack trace to see the original file, line and code.

Source map viewer

Example:

Source map

Parsed in this tab. Remote sources and external sourceMappingURL links are never fetched.

Result

Input changed — parsing automatically…

A production error report says the crash happened at app.3f2a.js:1:20931 — line one, column twenty thousand of a minified bundle. The .map file sitting next to that bundle knows exactly which TypeScript or JSX line that was, but only if something decodes its Base64 VLQ mappings for you. This source map viewer does that decoding and the lookup, so you can go from a stack frame to the original line without wiring up the source-map library in a throwaway script.

Reach for it when an error tracker has no symbolication set up, when you only have the build artifacts from CI, or when you need to check that a map actually matches the bundle it ships with. It also works as a source map decoder for the file itself: which sources are listed, which carry sourcesContent, which are on the ignoreList, and whether the mappings string is valid. Unlike online tools that fetch the map on a server, nothing is uploaded and no remote URL is ever requested.

Why use this source map viewer

It answers the question you actually have — which original line is this — for every frame at once, and tells you when the answer is only approximate.

Paste the whole stack trace, not one position at a time

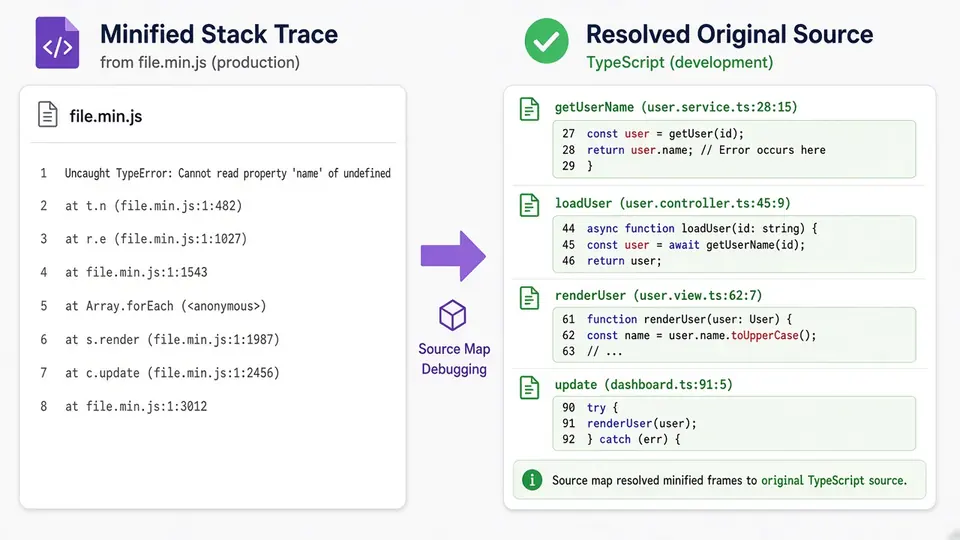
Every line that ends in :line:column is looked up against the map: you get the original file, line, column, the original identifier name and a few lines of the original code around it. Frames that come from a different file than the map describes are flagged, so a vendor-bundle frame is not silently resolved against your app map.

A minified stack trace on the left, each frame resolved on the right to an original TypeScript file and line with the matching code highlighted.

See, and get back, the sources the map carries

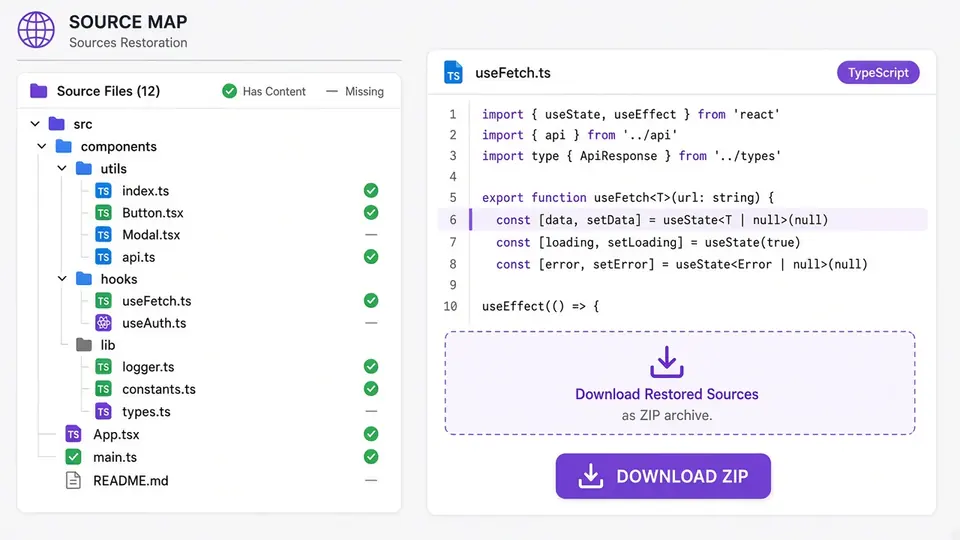
The Sources view lists every entry in sources with its sourceRoot applied, marks which have sourcesContent and which are on the ignoreList, and shows the embedded code with line numbers. One click saves a single file, or all embedded sources as a zip with their folder structure — useful when the map is the only copy left of the original code.

A list of source files from a map, some marked as missing content, next to one restored TypeScript file with line numbers and a download-as-zip button.

Three things that make lookups come out right

01

Give it the map in whatever form you have

Paste the .map JSON, open or drop the file, or paste the built JS or CSS file itself: if it ends with a //# sourceMappingURL=data:… comment, the inline map is extracted and decoded (Base64 and URL-encoded both work). A sourceMappingURL that points to a normal URL is reported, not fetched — open that .map file here instead.

  • The )]}' anti-XSSI first line and a UTF-8 BOM are stripped automatically, so maps saved straight from a server response parse as-is.
02

Check which way the columns count

Positions accept 12:345, a bare "12 345", or full frames such as at n (https://example.com/app.js:1:177). Columns count from 1 by default because that is what Chrome, Firefox and Node print in stack traces. If your column came from the mozilla/source-map library or a raw 0-based field, turn off "Columns start at 1" — otherwise every answer is off by one character.

  • Lines without a line:column, such as the error message line of a stack trace, are skipped and counted instead of failing the lookup.
03

Read the confidence, then go the other way

An exact hit means a mapping segment starts at that column; otherwise the nearest segment to the left is used and the result says so, which is the same rule browsers and the source-map library apply. "Open in Sources" jumps to that original line, where the original-line box does the reverse lookup and lists every generated position that maps back to it.

  • With auto-parse off, Ctrl/Cmd+Enter runs the parse and lookup from anywhere in the panel.

What the decoder takes apart

Every mapping segment, decoded

The Mappings view turns the VLQ string into rows of generated line:column → source, original line:column and name, 100 at a time, and exports the full table as TSV for a spreadsheet or a diff.

Original line back to generated code

Pick a source and an original line to list all generated positions that point to it — handy for checking whether a line was inlined, duplicated or dropped entirely by the minifier.

Inline, indexed and ignore-listed maps

Inline data: URLs, indexed maps with sections and offsets, sourceRoot joining, and both ignoreList and the older x_google_ignoreList are understood, so framework files can be told apart from your own.

Errors that point at the broken segment

Invalid JSON is reported with a line and column; a bad VLQ character, a segment with the wrong number of fields, or a source or name index out of range names the generated line and segment where it happens.

What it does and does not do

Nothing is fetched
External sourceMappingURL links, http(s) entries in sources and indexed-map sections that reference a URL are shown but never requested. The map, the sources inside it and your stack trace stay in this tab and are not written to the URL or local storage.
Version 3 only, up to 50 MB
Only Source Map v3 is accepted; version 2 or unversioned files are rejected with a message. Input above 50 MB is refused, and very large maps can pause the page for a moment while they decode.
Lookups snap to the left, never to the right
When no segment starts exactly at a column, the result uses the closest segment before it and is marked as approximate. A column inside bundler-generated glue code reports that the segment has no original position rather than guessing a nearby one.
No sourcesContent means no code
If the map was built without sourcesContent, lookups still give the file path and position, but no snippet, preview or zip entry is possible — the original text simply is not in the file.
One map per lookup
Each map only describes its own bundle. Frames from other files are flagged but still looked up, so check the warning before trusting them. A colour-coded visualization of every segment, and editing or merging maps, are out of scope.

Source map viewer FAQ

How can I take a minified JavaScript stack trace and run it against a source map to get the proper error location?

Paste the .map file into the source map viewer, then paste the whole stack trace into the positions box. Every frame with a :line:column is resolved to the original file, line, column and identifier name, with the surrounding code if the map includes sourcesContent. Frames from a different bundle are flagged instead of being mixed in silently.

Can I reconstruct the original JavaScript source files from a minified version and its source map?

Yes, when the map contains sourcesContent: that field holds the full original text of each file. Open the Sources view to read any file, download it, or save all of them as a zip that keeps their folder structure. Without sourcesContent the map only stores paths and positions, and the code cannot be recovered from it.

Are source map line and column numbers 0-based or 1-based?

In the format and in the mozilla/source-map API, lines count from 1 and columns from 0. Browser and Node stack traces print 1-based columns, which is why this tool starts columns at 1 by default. Switch it off when your column came from a 0-based source; line numbers are 1-based either way.

What happens if sourcesContent is missing from the source map?

Lookups keep working and still tell you the original file path, line and column, because those come from sources and mappings. What you lose is the code itself: no snippet, no preview and nothing to put in a zip. The Sources view marks each file without content so you can see at a glance which ones are affected.

Is it safe to ship JavaScript source maps to production?

A public .map with sourcesContent lets anyone read your original code, comments included, so many teams upload maps only to their error tracker or serve them behind authentication. Checking a map here does not add to that exposure: parsing happens locally, and nothing you paste leaves the browser.

Still have a question?

Open your map in the source map viewer

Drop in the .map file from your last build, paste the stack trace from the bug report, and the source map viewer shows you the original line in seconds.

Everything runs locally in your browser.